Well what do you know? When the markets closed on Thursday, we had witnessed a day when not a single market tipped its hand, steadfastly refusing to give traders any idea which way it would be headed on Monday morning after a 3 day weekend. In the last pub I had mentioned the air pockets that lie just beneath all markets and that there were H&S patterns showing up in large numbers seemingly everywhere. Add to the mix the fact that market internals were in such an incredible negative divergence with the equities markets and we suddenly find ourselves looking at the possibility of seeing the markets drop into the abyss. Let's get started with a few charts that I brought from the last pub. Let me stick 'em up on the wall here and let's get started.
First up is a chart of IWM which I have full confidence in as being one of the biggest, fattest canaries in the entire world of western equities markets. Small caps lead, (in both directions) and when the markets closed on Thursday the Russell 2000 was poised right at the edge of the cliff.
 |
| Futures have shown what lies in store next week. Click here for a live and updating version with a couple of indicators. Click here for a 'print' version for those not subscribed to StockCharts. |
 |
| Pick anything you like and enjoy the rest of the week. We never run out of drinks in here. |
And in order to avoid looking like a complete idiot on Monday morning, here's a screenshot I took as evidence of what futures looked like on Friday when they closed. Again, this is the Russell 2000:
 |
| Futures on the Russell 2000 as they appeared at the close of futures trading on Friday, April 6th. |
Next up we take a look at a classic diamond pattern that formed in the S&P 500. It too provides a measured move opportunity that gives us a reasonable target. Keep in mind that the 'measured move' possibility comes from the white arrows and not from the diamond. In no way do I pretend that I "knew" markets would be headed lower based on the diamond because realistically they could end up being a 'reversal' pattern just as easily. All I was confident about was that "if" the markets headed lower, it would more than likely be with a vengeance.
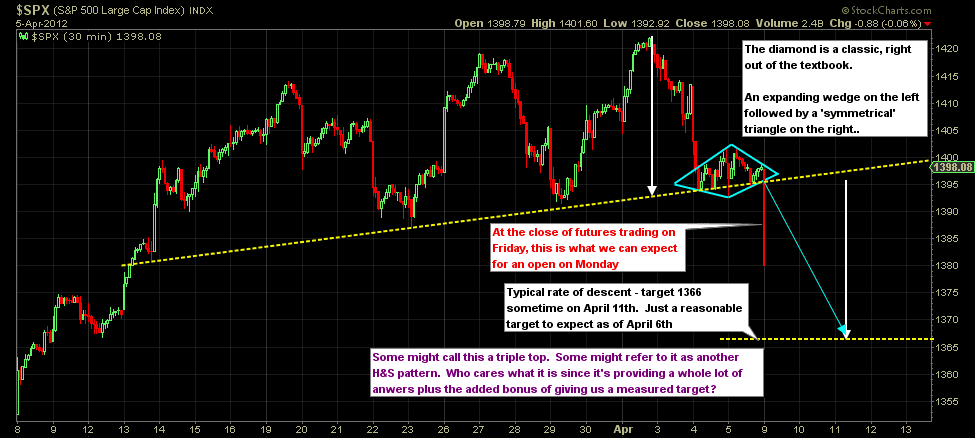 |
| The potential target of approx. 1366 by Wednesday comes from the white arrows, not from the diamond. Click here for an updating 'print' version. |
Last week I was speculating on the fact that the first two waves down from the recent high were of equal length, that the next move lower (the one that we're apparently going to see starting Monday) would be an extended 5th. I still think that's the case. So I expect the entire move beneath the "neckline' or whatever you prefer to call it will be a 5 wave structure. If that's the case, the target shown will probably be exceeded judging by the length of this first candle alone that's apparently going to show up first thing on Monday. That measured move as shown is a 'minimum' and not necessarily the full extent of the decline.
==============
With the chart below I'd like to demonstrate why I focus on the market internals data as much as I do. This kind of information is crucial to understanding whether or not a sustained rally (or decline) is real or not. Many times it is very real, with a head of steam that is surely not going to end anytime soon. At other times, it's as phony as a 3 dollar bill. Lately it has more or less been doing the old Wylie Coyote trick. Sooner or later a market has to either pull back or crumble completely when it becomes apparent that fewer and fewer horses are pulling the old stock wagon up the hill. More often than not it's just a pullback. When we're in a bull cycle that is, as has been the case for the past 37 months.
Here's what has been happening with the number of stocks that are considered "bullish" as determined by their point and figure charts, aka the Bullish Percentage. The chart looks kind of "busy" but really, it's the annotations that best describe the more poignant things to be watching for. In order to make it "less busy", I've removed the S&P 500 as an overlay and have placed it in a separate panel below. I've also provided a link below the chart to the version which shows the both of them overlaid against one another:
 |
| Bullish Percentage betrays undeniable market weakness when it occurs. Click here for a version where the S&P 500 is moved up to become an overlay. It might look a bit "busier' but it's the best way to actually appreciate the divergences. If you left click either chart in order to bring up the "lightbox" you can then toggle between the two versions. |
Good work AR, Dow and Russel Futures look ready to fall off a cliff too.
ReplyDeleteI just want to say that when I posted a comment yesterday about anticipating a Monday gap up I mentioned the condition of there not being a disastrous NFP report this morning.
ReplyDeleteI'm thinking this morning's futures drop broke the back of the advance. I suppose that diamond pattern gave us a tip that it would be bad. Would it be valid to view that as a version of the EW triangle?
It's days like today that give me a little faith in the laws of gravity trumping the Bernanke Putz...helluva morning today...I was actually giddy even though I am all cash. This was the day I've been waiting for....for quite awhile.
ReplyDeleteAlong the lines of my position that the GDOW is a far more accurate map of where social mood actually is than the heavily-intervened US markets, and that P3 is underway and the top of Intermediate 2 of P3 is quite possibly now in (which means Intermediate 3 of P3 could already be beginning), here's a chart showing that the major Bradley turn date of March 16, which failed on the America market tickers, possibly did not fail on the GDOW. I'm not too keen on Bradley dates myself, but I thought it interesting.
ReplyDeletehttp://i.imgur.com/btHPy.png
IMO anything that makes sense is valid when there's likely a lot of intervention distortion in the tickers.
ReplyDeleteNew Pubolicious
ReplyDeleteYes. That would be valid. I am not saying it is right. What I am saying is that is what we call a "hard reset." I have seen that move far more than once (okay, less than 20 times, but I am new).
ReplyDeletehttp://youtu.be/lWdG8NoFXY0
ReplyDeleteI continue to reiterate the cycle turn dates coming up on April 24th and May 17th, both of which have marked crucial turning points in the past. Perhaps the 24th will be the initial bottom, with the 17th being the final bottom?
ReplyDeletehttp://silversaxena.blogspot.com/2012/04/futures-breaking-down-preview-of-whats.html
Lol... doc, my good man, you almost sound apologetic for having called for a gap higher (barring a bad jobs report). Please don't feel that way bud. Nobody's gonna hammer on you nor anybody else here for having had the courage to step forward with a valid opinion. I appreciated reading that opinion of yours but I didn't necessarily agree with it. Nonetheless, it was 100% valid although it also served to scare the shit out of me for a short while. Because you could have just as easily been right as you have often been in the past. There's no need for anybody to be shy to make a call in here because nobody's going to attack you or harass you if the call turns out to be wrong. That's the kind of shit that happens on one or two other sites on the internet that are dedicated to the study of markets, although I can only think of one offhand. In here, the objective is to help each other make some money. That's the bottom line and by golly we're not going to put up with people who aren't team players. You're a team player doc, always have been. Trolls and critics can just stuff it... they're not team players and they won't be tolerated in here. Keep 'em coming doc, by all means.
ReplyDeleteI still think he might be right...lol..that's my call! Might be right. Yayzzz.
ReplyDelete"I suppose that diamond pattern gave us a tip that it would be bad.
ReplyDeleteWould it be valid to view that as a version of the EW triangle?"
Doc, on the very final minute of market action on Thursday I could see that diamond. But it still did not give me any confidence at all that the market would gap lower because diamonds can just as easily be a reversal pattern. Had it reversed with a gap higher on Monday it obviously would have panned out exactly as you predicted. In fact, based on the diamond alone, the odds of you being right were probably about 50/50. But now that it's started, a diamond would also represent approximately the middle of the entire move lower. So that fact, along with the fact that the first two downward legs (let's call them 1 and 3) were almost the same length, I'd expect an extended 5th. That would fit perfectly with the notion that the diamond should be approx. in the middle.
My daughter had the pleasure of seeing U2 perform live. My favorite song they ever did was Where the Streets Have No Name.
ReplyDeleteI like that Papa. Thanks. Just today I deleted a chart out of my inventory (purposely). On it I had noted all the Bradley turn dates of the past year. But all of them had passed and I am unaware of the dates that lie before us. Do you know what they are?
ReplyDeleteYou appear to have been right with your comments about the aud:jpy.
ReplyDeleteWe've seen plenty of bearish signals over the past few months. Most were bear traps.
ReplyDeleteI was ready to sell futures Friday morning when the announcement came, but ES went right to the bottom of the daily BB and who's gonna be happy about shorting there? But if this is the real thing, that's their nature. They don't provide comfortable entries.
Yeah, that's one pair that is oh so faithful as a measure of the appetite for risk. It's just astounding in it's loyalty to the S&P. I really watch that one closely. A lot of people think the AUD:USD is the best measure of "risk on" or "risk off" but it isn't nearly as faithful so I don't even bother with it.
ReplyDeleteFor what it's worth, Tom McClellan is calling for "a big honkin' rally" starting in June... but not before. In other words, he's expecting that we're going to be in a decline until then. By the say, this short video was recorded last week before the futures sold off on June 6th. If his name sounds familiar, it was his father who invented the McClellan Oscillator, one of the most dependable measures of market internals action... also known as $NYMO.
ReplyDeletei believe Keystone Speculator tracks the Bradley dates on one of the charts on his public list.
ReplyDeleteabsolutely...Ive been playing the FTSE,where I think the pattern has been clearer but Monday's rally was very uncomfortable...I took a long position in the Dow as a hedge on Friday and am happy to say it was stopped out for a small loss
ReplyDeleteHere's a page with a chart showing the 2012 dates. The major ones are in bold. As I understand it, the up or down waves of the chart are not market direction indicators, but more indicators of momentum and the magnitude of turns in sentiment or mood. Can't vouch for the page, it just turned up on a Google search when I was looking for them.
ReplyDeletehttp://forbestadvice.com/Money/Gurus/DonaldBradley/BradleyTurnDates2012.html
http://www.youtube.com/watch?v=9_S-nIWhWUU&sns=em
ReplyDeleteFavorite Dylan song (today).
Don't know if there's a version by Dylan out there, but this one is pretty good.
If it's Intermediate 3 of 3 down getting underway (and I'm thinking it is), the trouble in using EW will be that on the US tickers the Minor degree corrective waves could overshoot (due to intervention possibly even more aggressive) just as Intermediate 2 did, and EW theoreticians relying on American markets will have even less of an idea where we are in the big social mood wave picture. Just speculating, but something like this:
ReplyDeletehttp://i.imgur.com/edvds.png
Hi Scotty. I replied to your comment about 10 hours ago... still waiting for it to show up. Man, my computer is slower than I thought. Can't remember what I'd said exactly either although I do recall mentioning that for one to be 'all cash' at the end of trading on Thursday was a very good move. Even though I could see that diamond forming, nobody including me had any idea whether the market would gap high or lower since a diamond can be a reversal pattern just as easily as a continuation pattern. I did add to shorts with a few minutes to go on Thurs. but only because I felt that with the air pockets just below the market, 'if' the markets decided to head lower it would be with a vengeance. So it was only a small addition and I'm mostly in cash as well. Mind you they were options that should be worth double on Monday morning. I might be tempted to take the profits on those at the open and play with Goldman's money for the rest of the week :-)
ReplyDeleteThat scenario could agree with the expanding wedge that Binve and (at the risk of sounding Wagnerian) Planet Yelnick have posted about.
ReplyDeletelol...probably Disqust saw us having too much fun...I'm kicking my left buttocks over missing that glaringly obvious Cool Patterns 101: Diamond. The right buttocks is still healing after wearing my shorts in early January. That's okay...Now that I'm playing with the TF (on paper so far) I've finally come to the realization that the market is always there and I can get in anytime short or long...No worries. I've actually been doing quite alright not confined to RTH (i.e. waking up to unfavorable gaps.) Just a couple of points at a time netted me 26 TF pts over a couple of days. OX will make a ton of money off of me until I become a bit more educated, patient, and nimble, but that's okay. I'm waiting on the verdict of Monday's action before I jump into any TZA...my left buttocks thanks me for that.
ReplyDeleteTaking profits is never a bad thing (I have finally learned)...I dumped my SLV on Wednesday with a small loss when things seemed to be going south. I didn't hesitate one bit, which is an improvement in behavior on my part. I would be not be hesitant to sell those puts...the slightest manufactured hint of QE could whipsaw (temporarily). Those crafty bastards at GS know how to steer these broken markets. But at the same time, I remain confident that "good news is bearish" at this point, as the free money addicted PDs need something bad to happen if they want more sugar on their stale corn flakes.
I must buckle down on learning all of these extremely useful techniques. There is so much to learn. You and Mr. PL have been a bit inspirational...You guys really pull it all together into something that's actionable. Plus you both have attracted some great participants. I actually feel a bit useless at times, having never actually posted anything of merit to the good people here other than a bit of levity (that keeps my marbles arranged.) You guys really have set the bar at a very respectable level. I guess what I'm trying to say is "Thank You" for all of the work you and all of the posters do, and providing a place where much more astute traders can share their thoughts with plebes like myself.
Here's to the first one of the day
ReplyDeleteA friend once told
one martini is enough, two is too many, and three is never enough
I'll stick with beer
The new beast best guess
You're at no risk of sounding Wagnerian Greener, lol. Binve is a great guy, a person I consider as a good friend. We don't chat "a lot" but he's a very classy gent, is very friendly to this blog and always wide open to discussion. He and I have discussed whether or not the markets are headed higher or lower and he was one of the people who called for 'higher' when all of us bears were continuously expecting a top. I'm totally open to his perspectives. By the way some of our friends comment over on Binve's site as well. It's kind of funny that 'oneofdaworst' little peckers ever to have tarnished a blog has been commenting over there recently too. Even he must be getting sick of what has been happening at the old haunt.
ReplyDelete"A zigzag needs to complete the pattern and we would now be in the b wave part of it with c to follow."
I'm absolutely wide open to that idea. Thanks Greener.
"I actually feel a bit useless at times, having never..."
ReplyDeleteMan... you're a friend and that's all that matters. I was stunned a couple of weeks ago when I noticed how many people are visiting these pub sessions. But Imagine how Pretzel feels when he sees approx. 10,000 visitors every single day. How many of those people are commenting? How many of the visitors to my own little blog are commenting? Not very many on a relative basis. And I've always felt that the vast majority of visitors come to these blogs just to read... just to maybe pick up a tidbit or two. Most of them are too shy or feel that they might not have enough technical expertise to comment. We know those people are out there. But they needn't feel 'inadequate' or 'unwanted', lol. To the contrary, they are appreciated. You my friend bring a lot of good cheer but have already cost me one keyboard thanks to an ample spillage of Pepsi that blurted onto it via my nose. That stings let me tell ya.
I must say though, I was really taken aback even a few minutes ago when I read you say "I'm licking my left buttocks over missing that glaringly obvious Cool Patterns 101: Diamond." Most people can only "kick" it. I'm still wondering how you managed to do that. And "why"? lol
ROFLMLBO...I'm gonna have to start wearing Depends or buy a better mop if I'm gonna read your replies cuz I just whizzed myself I was laughing so hard....To paraphrase Eddie Murphy, If I could lick my buttocks, I'd never leave the house....I haven't laughed that hard in a while. Thanks.
ReplyDeleteAnd to think I was moping after seeing "Hunger Games" with the Mrs. the other day. She told me it was the "feel good" movie of the year....NOT (but I knew that ahead of time)...There is a lot of truth to it though. Most of moviegoers will miss the message(s) unfortunately. I'm pretty sure Alex J was a technical consultant for both the books and movie. I think you'd appreciate it as much as I did. That wife of mine is a good egg...a demonstrably excellent inner-city public school teacher (not very well-paid contrary to popular beliefs) converted from a passive BO fan to an active RP supporter. She even laughs at my jokes.
Alberta - I've got ES 1366.75 - 1363.50 as initial target area for this drop, and if that doesn't hold then ES 1334.00 - 1330.00. Course it could flummox everybody and turn right back up Sunday night/Monday, but I don't think that's all that likely. At least I hope not, I happen to be holding short ES.
ReplyDeleteSorry meant double zigzag, so we would be starting b of y.
ReplyDeleteI love Binve's studies. The one he did on e inspired me to relearn calculus. I would prefer that his expanding wedge and analogy to the late 60s - early 70s was not correct, but it's obviously got a good chance of being right.
are we set up for another 1000 pt decline ? 900 pts is 1/8 of 7200 and "panic" could give us another 100 http://4.bp.blogspot.com/-iBAP8dgTVz0/T4AmPC77j7I/AAAAAAAAKPY/z1Ruauf6m-c/s1600/dax.jpg
ReplyDeleteSeems very possible as that lines up with the larger time cycle as well that should bottom around April 24ish. Those decline that are previously highlightedwere each 1 month peak to trough and this one would be another 1 month cycle decline if it plays out.
ReplyDeletegood point,thks
ReplyDeleteI'm absolutely open to that idea too, lol.
ReplyDeletelol seems like I'm stating the obvious, as I think you posted a similar gann cycle chart last week no?
ReplyDeleteyes but I hadn't joined the dots,as it were.Lol. Thanks
ReplyDeletecompletely agree (the market at least the US markets are super stretched so anything is possible here in terms of declines), but let's see what it gives us, as long as it declines into that date and is a buyable bottom, that's all any trader could ask for. Seems like the US markets could decline even more in order to catch up as the world equity markets are ahead of the game in terms of the selloff.
ReplyDeleteGary Savage http://smartmoneytracker.blogspot.co.uk/2012/04/stocks-have-reached-euphoria-stage.html
ReplyDeleteBut, what really makes having a possible bottom/turn date on around April 23 is the next FOMC meeting is April 24-25.
ReplyDeleteSo regardless of the scope of the decline, we should get some kind of selloff into the end of the month, very interesting indeed.
ReplyDeleteOnly 67 calories caught my eye. smile great site.
ReplyDeleteHey there nitram. Haven't seen you for a long time. :-)
ReplyDeleteBlogosphere is convinced we are in a bigger decline. They might be right. But looking at some charts says we are more near a decision point on bounce or bigger sell rather than a given that sell is on. Dr. Jr.s 1365 makes sense to watch if we get there before bouncing. Interesting week coming anyway and either way.
ReplyDeletehttp://i835.photobucket.com/albums/zz279/SoulJester/CHART_1-1.png
http://i835.photobucket.com/albums/zz279/SoulJester/Chart_3-1.png
http://i835.photobucket.com/albums/zz279/SoulJester/Chart_4-1.png
http://i835.photobucket.com/albums/zz279/SoulJester/Chart_2-1.png
Interesting charts SJ. Unfortunately though, sometimes I look at your charts and don't know what it is I'm looking at. Would there be any way to label them so we know what they are representing? Perhaps others know what T2101 is referring to but I have no idea. I truly appreciate that you submit charts that you have put a good deal of thought into, but often I don't know what I'm looking at, lol.
ReplyDelete