Over the past couple of years, the FED has pretty much pinned short term treasury prices down near zero, so out of the two components that make up the TED, it has been the European factor that is doing most of the moving. So for the past year or more, my focus has been on the European end alone... the LIBOR3.
The most important concept to understand is that if the rate of interest that Bank A is charging to loan money to Bank B begins to rise, it means that Bank A is perceiving Bank B of being a slightly riskier entity to lend money to than it was yesterday. I suppose it has something to do with the commonly accepted premise that when Bank A lends out money, it would like to get it back. The bottom line is that when LIBOR3 is rising, liquidity is no longer flowing as freely it was in days prior. What is most important when investigating such an important gauge of rates as LIBOR, is not its little day-to-day fluctuations, but the larger trend, and most importantly, any change in direction that might be occurring in that trend.
Let there be no doubt, a change in the direction of the trend in LIBOR3 has a direct correlation with the general direction of the equities markets. The trend itself doesn't necessarily present an overly tight relationship on a day-to-day basis, mainly because once rates begin to move in one direction, they tend to remain fairly loyal to that trend. Conversely, equities markets flip flop around on a daily basis like that fish you just landed in your boat. So to demonstrate the reliability of LIBOR3 as a good indicator of what is likely going to happen in the equities markets, we begin by looking at a longer term snapshot in the weekly chart below:
 | |
| Click here for a full blown version of the live and updated chart |
I draw your attention to the candlesticks which represent LIBOR3. The orange line represents the rate on 3 month US treasuries but it has been toned down so as not to detract from our focus. By far, the most import aspect to consider when seeing a change in direction of LIBOR3 is to ask "Why did it change direction?". As can be seen in the chart above, the FED
had already begun to ease rates in early 2007, a time when it seemed the equities markets were healthy and apparently headed higher forever. In fact, they were approaching their peak. What did the FED know that we didn't?
Consider this: In August of 2006, the FED began to ease up on rates at a time when the equities market had already been surging steadily for the previous 5 years. At the same time, LIBOR3 suddenly flat-lined. Up until that point, both FED funds rates and LIBOR rates had both been rising steadily in perfect lockstep, as if to clamp down on an overheating economy. Again, we ask the question: "Why did rates suddenly flatten out at a time when there was no sign in the equities markets that anything was amiss? Why would a central bank lower rates in an economy that is apparently hot and getting hotter with each passing week? What did they know that we didn't?". They knew a liquidity crunch was on the horizon, that's what. I suppose an analogy could be made that the actions (easing) by the FED "telegraphed" the approaching punch. LIBOR3 was the punch itself. In any event, from that point forward it seems that the direction of rates has not been something that the FED nor the ECB has had any choice about... it has all been reactionary. The word "accommodative" comes to mind. Perhaps a more appropriate word might be "we're up shit creek and the world can no longer afford high rates and we need to stimulate more free money".

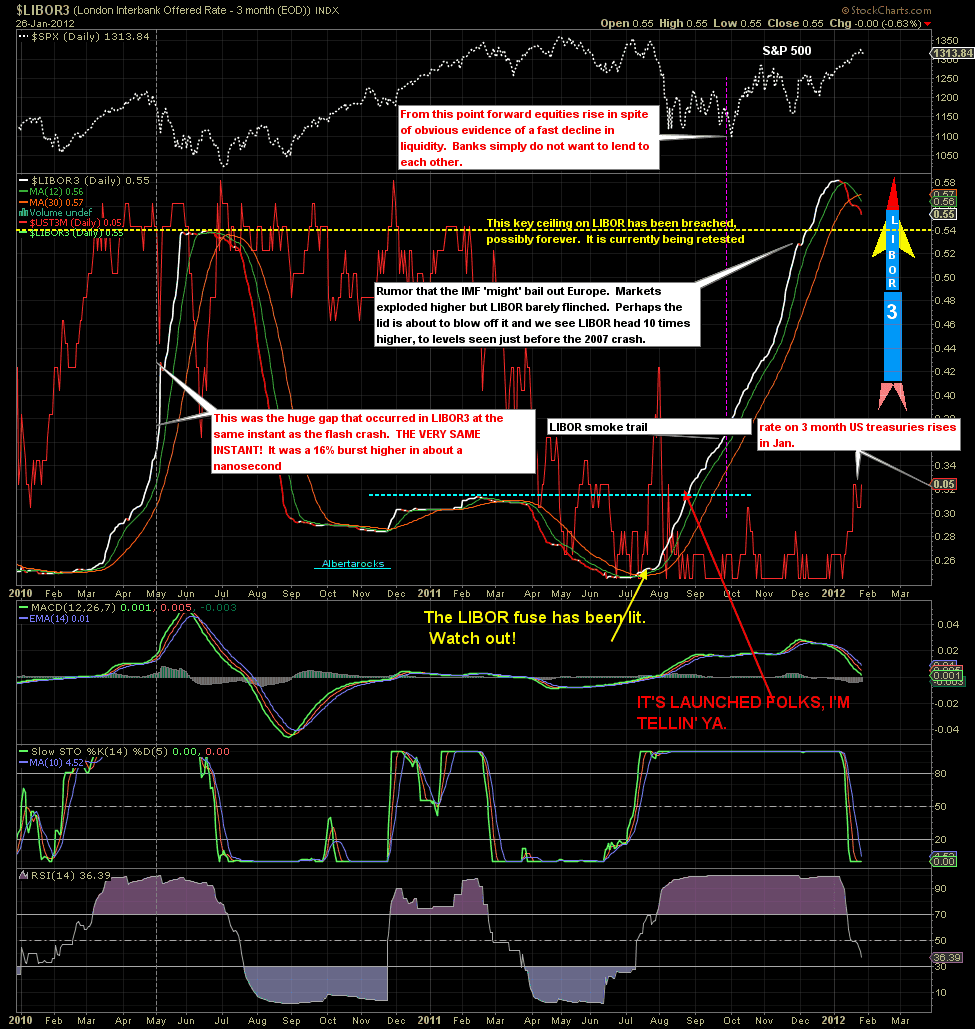
So we zero in and take a closer look to the more recent action in the daily chart below. Before you start laughing I should probably explain the goofy little rocket. I began to present this chart and my arguments that LIBOR was about to begin to rise sharply, as early as August of 2011. In fact, it was right at the time where the yellow annotation says "The LIBOR fuse has been lit." As LIBOR began its relentless journey, I added the rocket and the annotation "IT'S LAUNCHED FOLKS, I'M TELLIN' YA". The rocket was my way of emphasizing that we're not just looking at some minor run-of-the-mill event here. So quite inadvertently, many people now recognize this as the "rocket chart", so I might as well leave the goofy thing on there for a short time longer. In any event, rightly or wrongly, I was convinced that we were looking at something far more serious than just a minor blip in rates. It was all about "Why are they rising?".
 |
| Click here for a full blown version of the live and updated chart |
As the chart above clearly shows, LIBOR3 began to creep higher in March of 2010 (in spite of the central bankers' preference that it remain low). Finally, on May 6th, the flash crash event occurred. At the very same instant, the rate on LIBOR3 surged 16%. There's no point in arguing the flash crash had nothing to do with lack of liquidity. It was all about lack of liquidity and the banks knew it. BAM... that was one solid punch courtesy of LIBOR. Some will argue that correlation does not necessarily imply causation. True enough, but you know what? Who cares? Whatever it was that caused the LIBOR3 to spike 16% in a heartbeat was also the cause of the flash crash. The flash crash was no fat finger caused by some punk behind his computer or some bot that went rogue. Whatever the reason, the flash crash was not even an event caused within the equities markets, it was a reaction to an event within the "liquidity' markets". The bots only reacted to it and LIBOR3 is simply a way of measuring it. And now, LIBOR is on the rise again. And as always, just like clockwork, on the day that LIBOR began it's current ride higher, equities reacted almost instantly. Witness the action of July 22, 2011.
The most important takeaway at the moment is that LIBOR3 has recently surpassed what had been a previous resistance level at 0.054%. Earlier this month, the inter-bank rate turned lower and appears to be on a mission to retest that level. I can't see that previous resistance point as doing anything other than providing support now. To think otherwise would be to assume that for some unknown reason, banks are now somehow healthier than they were just a month ago. I don't see how that could be possible. Should that level hold and LIBOR once again bounce and turn higher, then the pressure on equities going forward would likely rise substantially. I don't see how it would be possible for equities to continue to surge in the face of ever-decreasing liquidity. They couldn't do it in the past and who in their right mind would expect that they can do it today?
In any event, a funny thing happened on Nov. 26th. The equities market suddenly began to defy the fact that rates were still rising. You can see that event identified by the WTF? comment, which of course is simply asking the question "Why's This Flying?". Great question! So is the other one.
AR,
ReplyDeleteThe Feds Decision Says
BUY STOCKS !!!
http://markethighsandlows.wordpress.com/
Yes, the market is also certainly taking that cue. So there seems to be a conflict in signals. We'll see how it pans out.
ReplyDeleteKeep an eye on the BDI...which seems to be headed for another crash.
ReplyDeleteCommercial real estate is about to crash and burn...and the last of the ARM re-sets is working through the system. (compare with troubles in equityville.)
Hey there WB. You're not kidding about the BDI. Have you ever seen a nicer example of a cup and handle than this one?
ReplyDeleteAnd you've sure got the real estate picture figured out as well I sold real estate for 10 years, a lot of that work being on the commercial side. So I am very familiar with how a value is placed on a commercial property, whether it be a high rise office tower, a strip mall, an industrial park, a big residential building... all of it. And the only thing keeping commercial RE afloat right now are the low rates.
Here's an example: If rates were to spike just 1%, a commercial property which today is valued at a price where a buyer is satisfied to get 5.5% net revenue (based on it's price), and it produces a net revenue of $1M, then that buyer would be willing to pay approx $18M for that property. That cap. rate (net revenue divided by price) could vary of course, depending on whether it's in a thriving city with a great future or in Detroit. But regardless, if rates were to jump just 1%, then that same buyer would be demanding a return of 6.5%, no longer satisfied with 5.5%. Instantly, that same property would now only be worth approx. $15M. It would suffer a loss in value of approximately $3M (16.6%) thanks to a 1% rise in mortgage rates. So those who bought IYR and made a killing on it have done well. I just hope they realize what a powder keg they're holding onto.
Great article AR, Liquidiity is definitely the key word here champ. OBV is declining substantially across the stoclk markets.
ReplyDeleteVolume dropping away markedly in gold and silver the last few sessions and as our friend points out...What gives with the BDI???
Freight rates may decline due to an over abundance of available shipping but to literally crash by over 50% in less than a month!
Like you said in your article....What do the Fed know??.................if looks like a pig and squeals like a pig, chances are ...........
Cheers matey.
Well all I can say in regard to QE 1 and 2 is .....FAILED!
ReplyDeleteI think the Japanese could offer some insights RE CB intervention and zero rates.....2 decades later and how has it helped them.
that was my interpretation too AR.I was surprised the market reacted so positively,and blown away by the gold price move
ReplyDeleteThe BDI and port traffic/cargo containers tells us what's coming in a few weeks and months. Almost everything else is a lagging indicator, imo.
ReplyDeleteIf we see a 1% rise in the rates on almost anything, the game is over, let alone in real estate.
I figger March tells the tale...and when 'Sell in May and go away' gets here? Yeah. I think we're lookin' at 2008 again, but with bells on. The next three months is where the short term traders gotta keep an eye on bonds and equities. Just my opinion, of course. In other words, I figger you've got that part nailed to the wall.
I could swear we're living in the "Matrix" these days. I have to admit
ReplyDeletethat the weekly chart of gold us looking super-bullish right now.
Volume bars on the weekly have exploded higher. So I
just gotta think gold knows what the hell is going on. If it turns out that the entire argument for a deflationary outcome is wrong, I wanna know about it real soon. In that case I'll just jump aboard the bull wagon, forget about it for the next ten years and get wealthy beyond my wild dreams. I still wouldn't be able to afford a flight to London after all is said and done though, because that ticket would cost somewhere around $495,000..
We're at the point where the bears has better bring their A-game. If this is a wave 2 higher, then I gotta admit the orcs have sure put up a pretty damned compelling illusion. It almost makes me barf to recognize that the current leg up look eerily similar to the leg up during Sept. and Oct. of 2010. Yucccch!
ReplyDeleteI'm gonna put together a short piece on the BDI since both you and Allenquinnell have brought it up.
ReplyDeleteThe week ahead: BIDU breaks out ? http://www.finviz.com/quote.ashx?t=bidu
ReplyDeleteOT, but I was looking at the videos you've got posted, there, AR.
ReplyDeleteYeah...I'm afraid I've gotta agree with you...the similarities in our tastes and politial beliefs are kinda scary.
Anyone who doesn't appreciate Bocelli just can't be a human being...and while I heartily disagree with Paul on a few issues, overall, he's the one politican in D.C. who is the closest to representing my own beliefs wrt government and liberty.
(On YouTube, see the Bocelli and Dulce Pontes duet from 1999.)
Good stuff AR - nothing new though, rather expect it now ; )
ReplyDeleteThe Fed opened the swap lines in November and the ECB turned on the spigot of Euros in January and once again all is right in the Keynesian Land of Oz! Wizard Ben is one of the best damn Twister players the world has ever seen with an endless supply of appendages to stomp down.
IMHO, the line in the sand has now been drawn at the recent 0.58% high as the ECB has given confidence to the banks that they will indeed let the euros rain down when need be. So for now liquidity reigns supreme again, however fudged up that may be on so many levels, and I would imagine Libor 3 to continue it's descent for awhile. But if this thing turns back to challenge that high, man oh man that rocket is going right up the arse and they'll be WTF's flying everywhere!
To be honest, I seldom look at individual stocks. But when you showed that chart I just had to make up a weekly chart for BIDU to see what it was doing. And the first thing I thought was "Holy shyte... that's a chart of gold." So I put them together to see how closely they were running and man... it's pretty impressive. See what you think:
ReplyDeletehttp://stockcharts.com/h-sc/ui?s=BIDU&p=W&yr=6&mn=0&dy=0&id=p91043996596&a=255487755
The ECB does not seem to be printing its way out of the mess they are in. At least thats not the way its playing out.
ReplyDeleteThey ( the ECB ) appear, at this point, to be resigned to a recessionary outcome, while convincing many that a
ruinous outcome has been averted. But, I'm not so sure a run of the mill recession can be guaranteed. And I'm not
so sure any one can predict how a recession in this context will play out.
http://pragcap.com/contraction-in-eurozones-repo-markets-is-driving-m3-decline
Very nice! Now that's what I call a great contribution. I wasn't even aware of that and the implications are huge. Thanks Iriquois.
ReplyDelete